Excerpt from the SEC Business Continuity Playbook, Dean Correia Contributing Editor
Business disruptions can take many forms. Before a BCP can be developed to address these disruptions one must understand what the risks to the organization are and how these risks might affect the business. This is the goal of the first core element of the BCP, called the "risk assessment".
Risk assessments should be conducted by a team of individuals who represent various business functions and support groups. As business plans change, risks and their possible effects on the business may change. Therefore risk assessments need to be reviewed on a regular basis to ensure they remain relevant and effective.
The assessment process should include hazard identification, determination of the likelihood of occurrence and possible impact on the business. This information becomes the needs or requirements that the remainder of the BCP must address.
Hazard Identification
Hazards are typically grouped into three categories: natural (fire, flood, pandemic), human-caused (hazardous material spill or release, terrorism, fraud), and technological (software/hardware malfunction). Risk information should be gathered from all local, regional, and national industry, association, and governmental sources. During this process, keep in mind that threats and vulnerabilities can be internal or external to the business. For example disruption to the business can be indirectly caused by crises suffered by suppliers, customers, the local community or government.
Vulnerability Assessment
Not all risks are equal. Risks that are extremely improbable or that have little impact on the organization may need to be treated differently than high cost events. Therefore, after identifying the hazards to the organization the next step is to determine the likelihood and possible impact of the events.
Threat Matrix and Heat Map
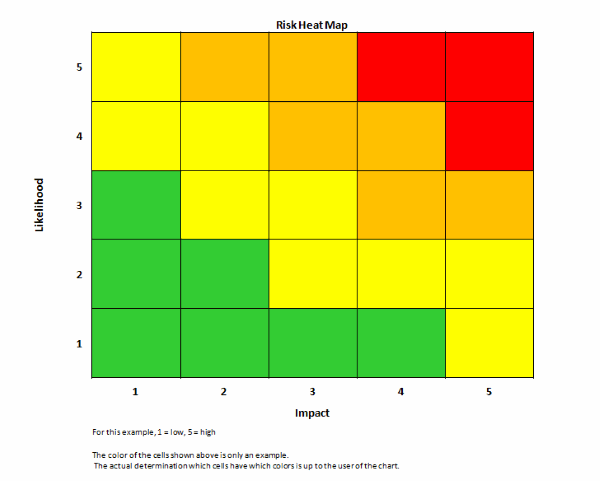
In order to effectively analyze and communicate the results of the assessments, they frequently lead to the construction of a threat matrix and "heat map" which show the relationship of risks to their probability and amount of damage to the organization.
The sample matrix below illustrates threat examples and demonstrates how risks can be categorized and quantified.
Note: this list is not exhaustive and should be tailored to reflect the organization’s operating environment.
Rate "Probability" as: 1 = Very Low; 2 = Low; 3= Medium; 4 = High; 5 = Very High Rate
Rate "Impact" as: 1 = Negligible; 2 = Some; 3 = Moderate; 4 = Significant; 5 = Severe;
Risk Rating = Probability X Impact
| Threat |
Impact |
Probability |
Risk Rating |
| Bombing | | | |
| Workplace Violence | | | |
| Robbery | | | |
| Supply Chain Disruption | | | |
| Loss of Key Talent | | | |
| Loss of Key Supplier | | | |
| Hurricane | | | |
| Fire | | | |
| Pandemic | | | |
| Tsunami | | | |
| Product Contamination | | | |
| Information Systems Disruption | | | |
| Loss of Proprietary Information | | | |
| Foreign Exchange Fluctuation | | | |
| Power Failure | | | |
| Work Stoppage | | | |
The various identified threats can be placed in their corresponding positions within a heat map based on their assigned probability and impact. The color of the cells in the heat map should be determined by the user to communicate the information appropriately to the intended audience.


