About This Research
The data used in this analysis were provided by SLRI members and Tier 1 Security Leaders™ of the Security Executive Council. All are risk management practitioners comprising a broad cross-section of industries. The organizations represented come from the public and private sectors; they range from small and medium-sized businesses to some of the largest international corporations.
Results, when possible, are broken down into categories so that participants can select specific metrics for comparison purposes. These details are provided when there is sufficient data to compare between categories or groups and when anonymity is assured.
Not all questions were answered by all participants. Data was only included when it was appropriate to do so; every attempt has been made to preserve the quality of the reported results. The SEC’s Security Leadership Research Institute (SLRI) strives to provide meaningful and useful information to its members.
The intent is to regularly update the results as more members join and share their information from all verticals, sectors, and industries. At the end of these highlights you’ll find information on how to participate.
Demographics
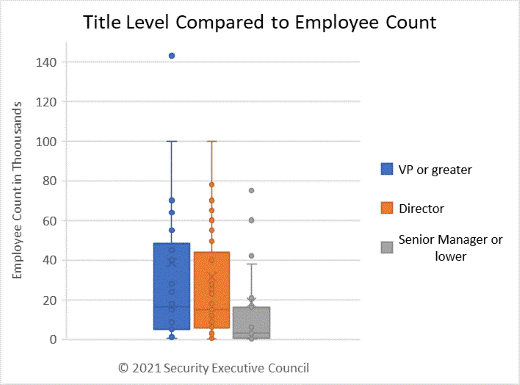
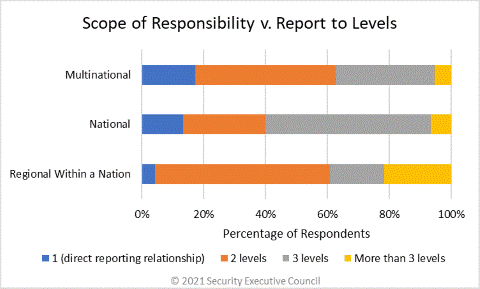
This 2021 report provides more data breakdown than previous iterations. Much of the demographic data, such as organization revenue, employee count, areas managed, title level, and report-to level, are provided in box and whisker charts to simplify benchmarking and offer meaningful comparison.


Report to level refers to the number of levels the respondent is removed from the top executive of the company.
The full report details report-to level by organization revenue, domains managed compared to security budget, report-to function vs. reporting level, and much more.
Budget
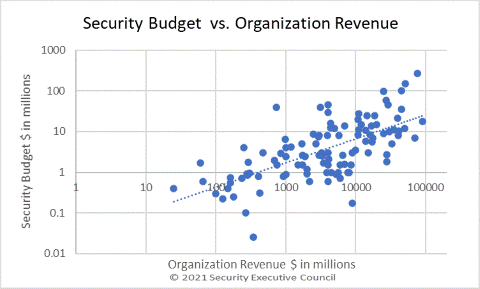
Every organization is different and approaches its security budget in different ways. The 2021 report provides averages across several different categories to provide risk management professionals a way to obtain a rough estimate of typical security budget size.
Average security budget reported: $13,254,850
Median security budget reported: $2,948,826

The full report breaks down budget by square footage, as a percentage of revenue, by sites covered, and more.
Staffing
On average, respondents reported one security employee for every 93 employees.

In the full report, data is broken down to compare budget per employee, uniformed security vs organizational employees, personnel cost as a % of budget and much more.
Security Programs
The report also details security’s responsibility and accountability by program. This year, the data is broken down by revenue, number of employees, budget, and more.
Access the Full Report
The Corporate Security Organizational Structure, Cost of Services and Staffing benchmark provides reliable, meaningful, and useful data that is specific to corporate security – something that cannot be found anywhere else. To access the full report, participate in the benchmark. It takes only 15 minutes to complete.
And please consider letting your peers at other organizations know about this effort. The more participants we have, the more valuable information we can provide.
Click here for more information about the SLRI.
You can download a PDF of the information shown on this page here:


